2020 All-NBA Voter Prediction
 Kristian Winfield wrote an excellent piece for SBNation detailing the multimillion-dollar ramifications these votes can have. And now that the official voting results are in, let’s take a look at what understanding and added value we can generate through Data Science.
The Trouble With Centers
In my previous All-NBA post I attempted to answer the question, “Who will be voted as the NBA’s best Center?” And after gathering data, modeling and plotting predictions I had this very simple and clear output.
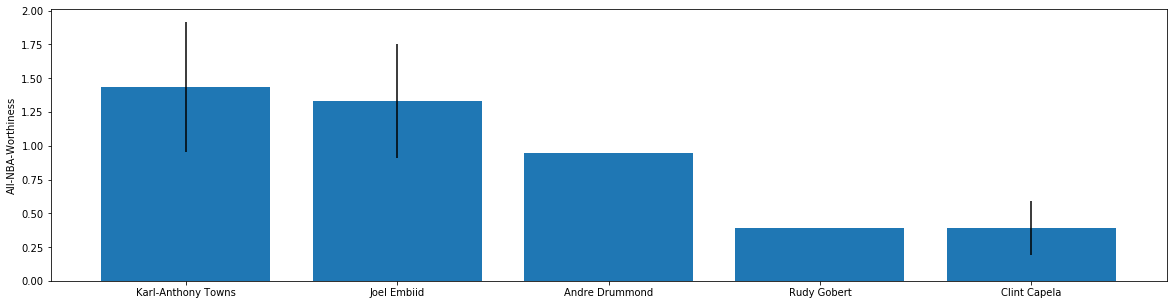 A first pass at modeling had given me a set of predictions for the coming season. But with knowledge of the domain, a few things just didn’t look right..
What is a Center?
For starters, Anthony Davis is conspicuously missing. And this is because according to basketball-reference he’d actually spent 51% of his minutes at Power Forward at the time of prediction. And because he’s listed as a Power Forward he doesn’t show up in the Centers-only dataset used.
Problematically for us, voters had no such issue with calling him a Center. In fact, prior to this season he’d been named the best “Center” in the NBA twice. This in spite of the fact that he self-identifies as a Power Forward.
Beyond voters having positional flexibility in casting ballots, other oddities arose in part because recently Centers have turned in historically unprecedented performances.
Since when can a Center pass like this?
Nikola Jokić is a problem. Not only in basketball slang, meaning his presence has to be respected whenever he’s on the court, but also because he confounds any model based on historical data. Looking at a partial dependence plot for the Centers-Only model, you can see there is simply no point of reference for Jokić’s 7.3 assists per game.
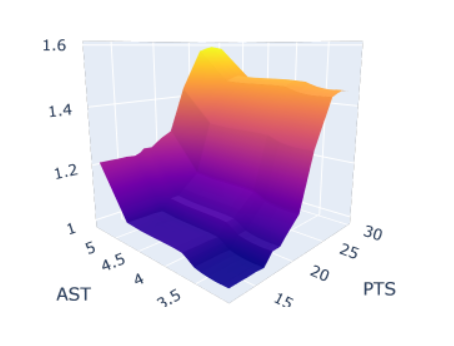
No Center in the history of basketball has ever before breathed that rarified air. Then it isn’t all that surprising the original model significantly underestimated how voters value what he contributes. He’s facilitating offense in a way no “big man” ever has.
S p a r s e D a t a
Two huge factors in the accuracy of predictions are the amount and quality of historical reference data. There is only one spot available for a Center on each All-NBA Team, so we have precious-little data to work with. 60 award winners over a 20 year period simply isn’t enough data for the model to learn from.
It isn’t completely without predictive power. When validated on the 2018-19 Season it gave reasonable predictions, correctly identifying the top seven vote recipients(in very recent years full voting totals are available). But only after accounting for Davis and Jokić does it order them correctly.
And it isn’t only a “Power Forward” playing Center or a Center posting statistics in an unprecedented way that causes issues with sparse data. Another important type of edge case, discussed in greater detail in the original post, is the effect injuries have on swaying voters. So few All-NBA-level Centers have succumbed to injury at inopportune times that the model has no chance of dealing with those rare occurrences when they appear.
Luckily we can do much better
Throwing out positions
Instead of building a model that only cares about what it means to be an All-NBA Center, what if instead we ask, “What does it mean to be an All-NBA player?” With a flexible definition of “Center”, plus using statistics from all NBA players irrespective of position, we go from predictions of:
| 1st Team | Karl-Anthony Towns |
|---|---|
| 2nd Team | Joel Embiid |
| 3rd Team | Andre Drummond |
| Runner Up | Rudy Gobert |
To instead predicting:
| 1st Team | Anthony Davis |
|---|---|
| 2nd Team | Nikola Jokić |
| 3rd Team | Rudy Gobert |
| Runner Up | Joel Embiid |
Which turns out to be perfectly correct.
In fact when we end up with the ability to make high-quality predictions for all positions. Below you can see the “Top 8” as determined by the expanded model which considers all players.
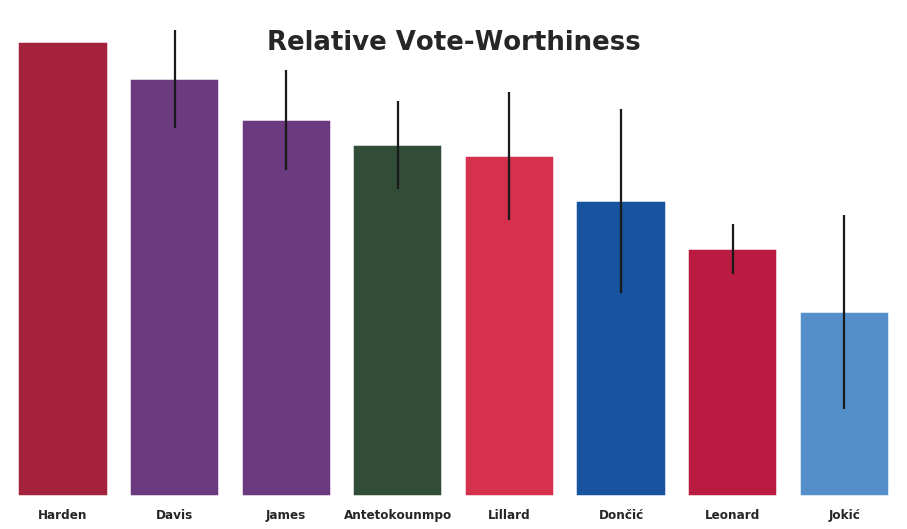
There is one place where these outputs don’t perfectly predict the All-NBA 1st Team. These predictions show that Lillard is favored by our model over Dončić. As it turned out Lillard was named to the 2nd Team, finishing as the 3rd guard behind Harden and Dončić. However, I am encouraged to see the confidence levels in our predictions are consistent with this outcome.
I am pleased with the end-stage output of this project. But beyond my satisfaction with the output, my favorite part of this project is what the process itself brought me.
Learning along the way
The real-world complexity that comes along with trying to join domain knowledge with machine-learning driven insight is my favorite aspect of this project. Numerous challenges and considerations came along with undertaking this project. And each taught me about, or reinforced my knowledge of, the practical realities of Data Science.
Error404: DataSetNotFound
For starters, this data set doesn’t exist as some perfect ‘data.csv’ file I could go download from Kaggle. To even get started I’d have to gather, join, process and clean everything myself. And even before all of that, I needed to use anecdotal evidence about how voters made decisions to guide what information I’d seek in the first place.
In the end I incorporated sources of traditional box scores, advanced metrics, and even team statistics. I decided to include team statistics because I’ve personally heard many of the voters for this individual award declare they won’t ignore team success. That’s alright. We’re trying to model the real world and the real world is odd at times.
My success in creating the data set which this project uses comes down to my ability to read the Pandas documentation. It’s amazing how powerful the ability to read and the desire to learn can be when combined.
The strange world of voting

The issue of voting brings along with it a set of challenges.
- There is no comprehensive archive of voting numbers, only award results
- Any vote cast for a player is at the expense of another player
- The historical record makes no distinction between a player who missed the 3rd team by a single point and one who was dead last in voting.
-
95% of eligible players receive no votes whatsoever
- That means all we’ve got for supervision in this supervised machine-learning exercise are the three players who were the top three vote recipients. The hundreds of other players unfortunately are labeled equally as non-winners.
And according to my research, there is no ready-made loss function that suits our purpose perfectly here. Even if a loss function based on rank order were easily available, within the limitations of our data, reordering players 4-400 wouldn’t change the loss values whatsoever. Hardly ideal.
But with this in mind I converted the “labels” of the dataset, that is their “Vote-worthiness” as follows:
Named 1st Team = 5 points
Named 2nd Team = 3 points
Named 3rd Team = 1 point
Otherwise = 0 points
There’s a reason behind this particular schema. Because by definition the players who received the awards are the right choices. And by labeling players in the way we have, we are essentially recreating the ballot of a hypothetical voter who over 20 years hasn’t given a single point to the wrong player.
It’s like having the voting record of only one person. But one who has never been wrong. And with that we can construct a Random Forest regression model to ask ourselves, “What would the perfect voter’s ballot look like?” We end up with a ‘vote-worthiness’ metric for all players with which we can make predictions.
Decisions in the face of uncertainty
Considering that the impact some of these award races might have, it made sense for me to calculate and display some measure of confidence in model outputs. Unfortunately for me Scikit-Learn doesn’t(at the time of publication at least) have tools at hand for retrieving confidence intervals in Random Forest models.
However, I was able to find an open-source library called ForestCI that does have that functionality! But it was also terrifically out of date. Hours and hours of Googling later and I was able to perform something I have learned is called “monkey-patching” in order to make the library function for me. That’s a topic for an entire other post.
Predicting Awards at Every Position
Future avenues of exploration
Given the amount of time and energy invested into this project I am happy with where it stands. But that doesn’t mean that if I had unlimited time and resources I couldn’t find ways to improve upon what I’ve done here.
“Podium” Loss Function
For starters, I think the best improvement might come from what I would call a “podium” model. That is, calculating loss in a batch over all players in a given season while predicting the three players who would ‘make the podium’. But because I was completely unable to find anything like this in any machine-learning framework I researched I will likely never know.
The option of writing my own custom loss function currently looks like the payoff would be worth less than the effort involved. One day that perception may change.
Hyperparameter Tuning
In hindsight I realize that a significant portion of time was spent working on high-level and domain-knowledge influenced factors. So tuning my predictions often ended up being focused on having a ‘good enough’ model and determining where errors in the end product were coming from.
I think this was a great method for making progress. I was able to refine my model and adjust my thinking rather than sitting back to watch a hyperparameter sweep that might take ages. But I see little harm from performing more hyperparameter tuning in the future. I anticipate there would be improvement, if only minimal.
Interpretation of Random Forests
Given that I’ve used a Tree-Based model, I don’t have to worry much about colinearity of things like Player Efficiency Rating and Wins Above Replacement skewing predictions. But I have read that it can lead to lowering reported levels of importance for other related features. And this can hinder interpretation.
Fortunately a there is a technique to calculate what are called “permutation importances” which are generally more reliable. The calculated permutation importances of my model are shown below
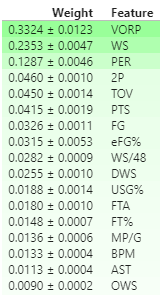
Buuuuuuut, even with all of the things permutation importance does well, “it tends to over-estimate the importance of correlated variables”. Luckily there exists another method that works fantastically to fix even this issue!
Unfortunately though, Drop-Column Importance calculation is computationally very expensive. Still, it remains true that springing for a fancier EC2 instance would in fact drive easier model interpretation. Which could go a long way when examining some of the stranger predictions the model makes.
I invite you to check out the Google Colab notebook containing a walkthrough from data ingestion to insight, including numerous visuals not included in this post(e.g. 3D interactive partial-dependence plot).